
FINVIZ combines fundamental and technical stock screening. AlphaMethodX organizes market research around Stage Analysis, with daily updates alongside confirmed weekly readings. A trader comparing them needs to look beyond the list of stocks a screen returns: the evidence behind each match matters too.
Stage Analysis places a stock in its price cycle: Basing, Advancing, Topping, or Declining. AlphaMethodX applies published calculation rules across its covered universe. FINVIZ lets you combine individual filters, including company financials and price measures. Its screener documentation sets out those filters.
This comparison is published by SURFThru and draws on both platforms' documented features, checked on October 18, 2026. It compares research tools, not trading results. The AMX screenshots are recorded product views, not current market readings.
| Research task | FINVIZ | AlphaMethodX |
|---|---|---|
| Narrow a stock list | Fundamental and technical filters | Stage, score, Mansfield relative strength, sector, and industry filters |
| Read the market | Advancers, decliners, new highs and lows, and moving-average breadth | Market Health, Stage distribution, index breadth, and daily participation |
| Compare groups | Sector and industry performance views | Sector and industry proxy Stages, relative strength rankings, and rotation |
| Read a heatmap | Performance and other selectable measures | Stocks grouped by confirmed Stage with daily relative-return context |
| Examine a candidate | Charts, financial metrics, and company information | Daily and weekly charts, Stage history, and scoring evidence |
| Monitor research | Saved screens and portfolios; Elite adds alerts | Watchlists, chart review, and daily context alongside published Stages |
FINVIZ's home page, Maps announcement, and Elite feature list describe its market views and monitoring tools. The AlphaMethodX features page lists the AMX views compared here.
A screen finds a condition; history shows how it formed
FINVIZ can combine earnings growth with price above a moving average, for example. That is useful when company performance is part of the research. Its filters include valuation, growth, trading volume, and price performance. FINVIZ screener help describes the available combinations.
A stock above its average might have just recovered from a decline or spent months advancing. Those are different chart histories, even when both stocks pass the same price filter.
AlphaMethodX records the Stage for each completed week and lets you search the order those Stages occurred in. A Stage sequence search can ask for a decline followed by a base, with a minimum length for each part. That makes the history part of the search rather than something you have to check after opening every result.
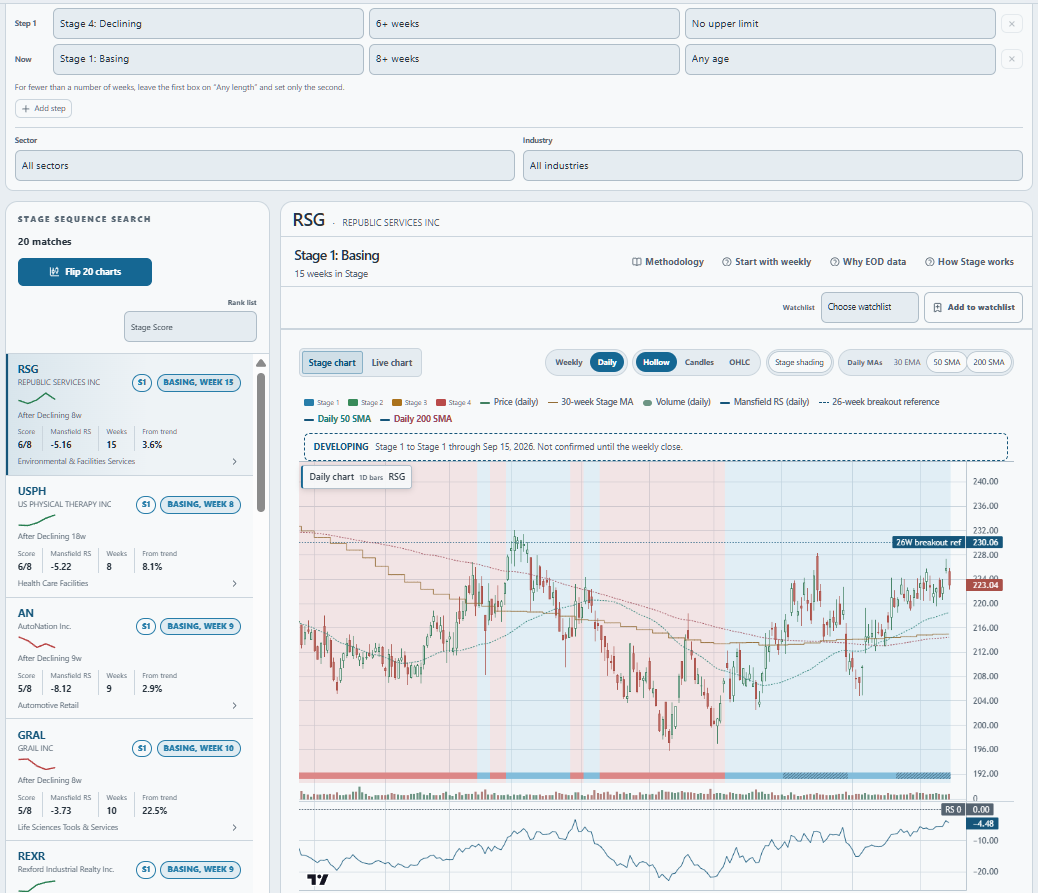
The score answers another question. AMX Stage Score reports how many of the applicable checks passed, with the values and rules available for inspection. It is separate from the Stage label. Two Advancing stocks can have different relative strength or moving-average evidence. A high score is not an estimated probability of a profitable trade.
Market breadth and daily updates
FINVIZ already shows market participation. Its home page includes advancing and declining stocks, new highs and lows, and the shares above and below key moving averages. Those measures describe different parts of market behavior; none should be confused with the index's percentage move.
AMX adds the distribution of stocks across the four Stages and the history of that distribution. Its Market Health score runs from 0 to 100. Index breadth lets you inspect participation within an index rather than assume the broad market and every index look alike.
Daily participation measures something more immediate. AMX counts a stock as strengthening when at least two of three checks are positive: price above its 20-day average, that average rising, and a five-day return ahead of SPY. The daily participation trend records that share session by session.
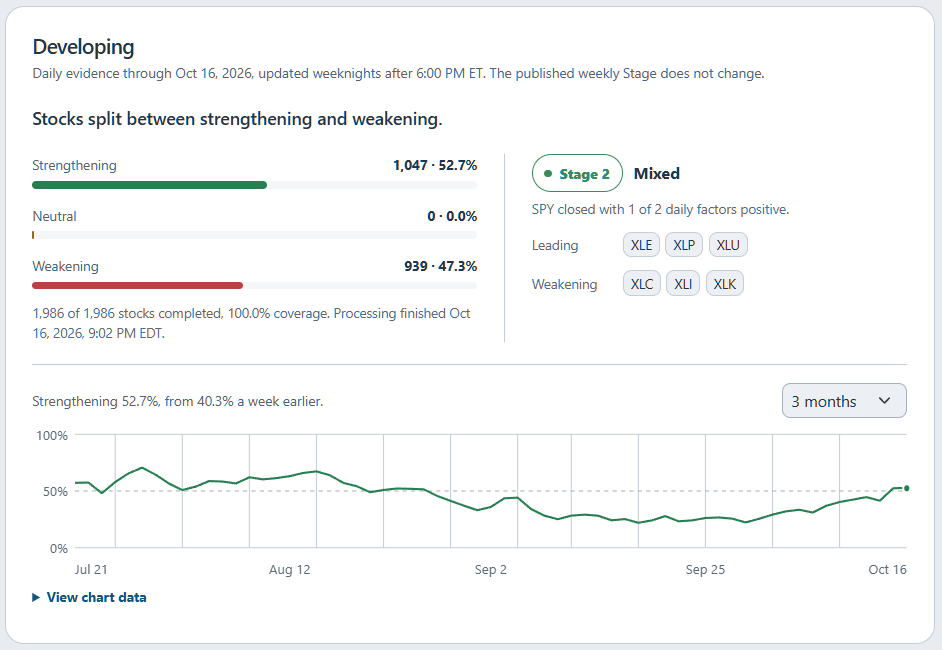
Daily charts help inspect near-term price behavior. The weekly chart determines the confirmed Stage. A trader can follow daily changes without treating every session as a new classification of the stock's longer price cycle.
Heatmaps, sectors, and relative strength
FINVIZ's maps support performance and other measures, and its Groups views compare categories such as sectors and industries. Its Maps announcement also describes category heatmaps and additional ways to organize the market. It would be misleading to describe FINVIZ as only a list of filter results.
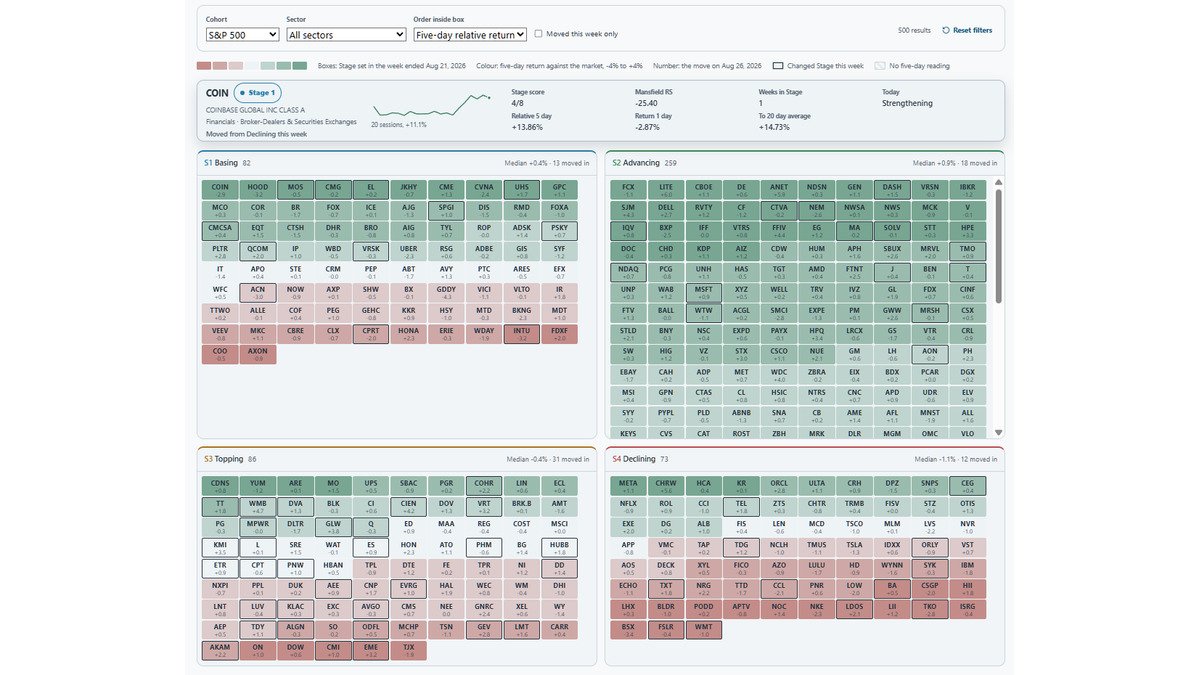
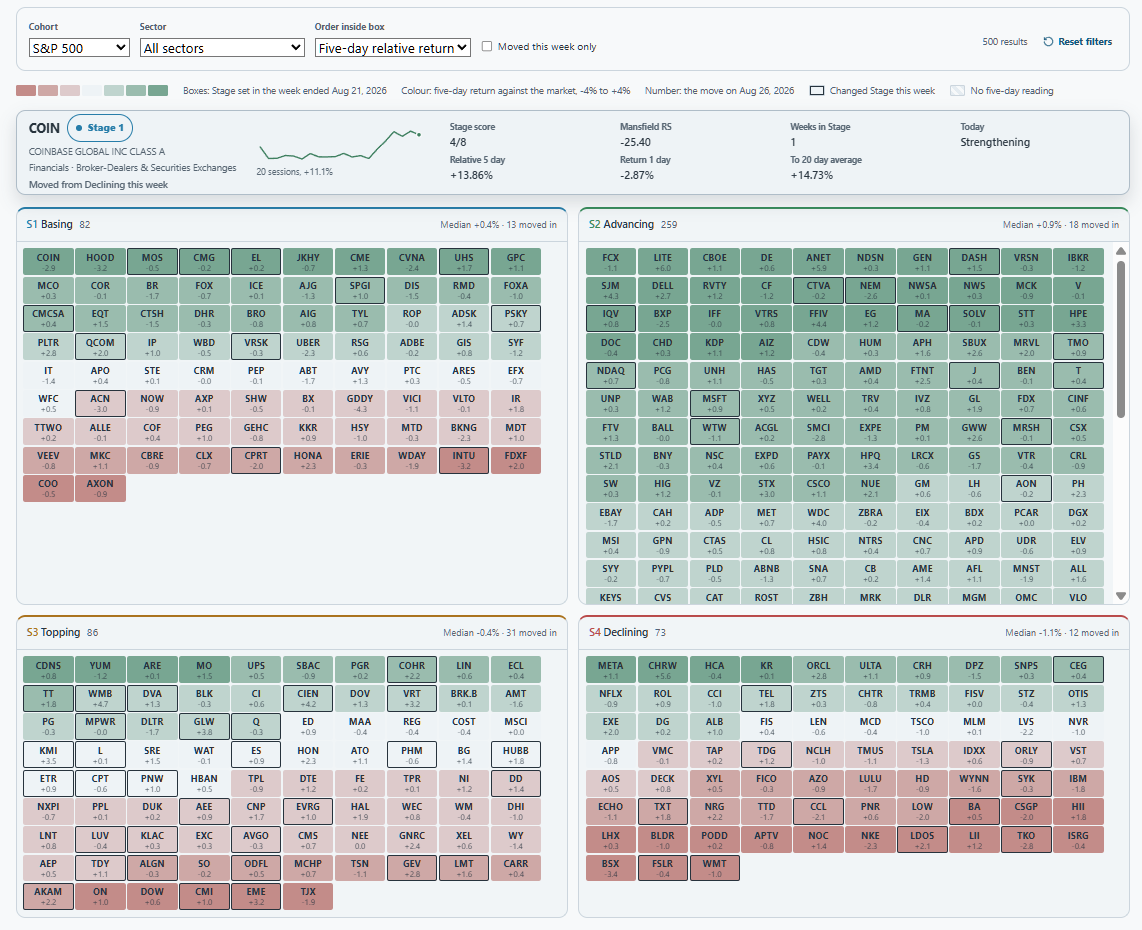
AMX groups stocks into four Stage boxes. The box records the confirmed weekly Stage; the default color represents the five-day return against the market. A stock can still be Advancing while underperforming over the latest five days.
For group research, AMX covers 11 sectors and 22 industry proxies. Each group's Stage comes from its representative ETF. The member stocks retain their own Stages, so an Advancing sector does not imply every company in it is Advancing.
Mansfield relative strength compares a symbol's ratio to the market with that ratio's own one-year average. A positive reading means the ratio is above that average, not necessarily that the stock outperformed this week. AMX's sector rotation chart plots smoothed Mansfield relative strength against its four-week change. It describes relative performance, not measured money flows or a forecast of the next sector to lead.
Choosing tools for the research you do
FINVIZ is a useful fit when your screening combines company financials with technical conditions. Elite also includes real-time stock data, interactive charts, and alerts. Those are meaningful capabilities for traders who need to monitor conditions during the session. FINVIZ Elite lists the plan details.
AlphaMethodX fits research that follows the price cycle from the market through sectors and industries to individual stocks. Its scans look for defined conditions, Stage sequences search the history, and the chart reel lets you inspect matches in ranked order. Watchlists keep the symbols under review together. The same framework extends to the platform's covered Macro ETFs and Crypto, with daily context alongside the weekly record.
AMX uses end-of-day data. It does not replace FINVIZ's fundamental filters or Elite's real-time monitoring. A trader can use FINVIZ for a financial screen and then inspect covered names in AMX for Stage history and market context. The reverse is useful too: a Stage-based candidate still needs any company research your process requires.
Both have free access and paid features. Compare the tools you actually need on the current FINVIZ Elite page and AMX pricing page, including data timing and plan restrictions.
Related reading:
Sources:
FINVIZ, Screener help, market overview, Maps and Groups update, and Elite features, checked October 18, 2026.
AlphaMethodX, features, calculation rules, and daily participation trend.
The platforms provide research tools. Stage labels, scores, screens, and warnings describe market conditions; they are not personalised investment advice or a recommendation to transact.